Fallen Stocks, False Bargains
Arvind / 23 Jul 2026 / Categories: Cover Stories, Cover Story, DSIJ_Magazine_Web, DSIJMagazine_App, Stories
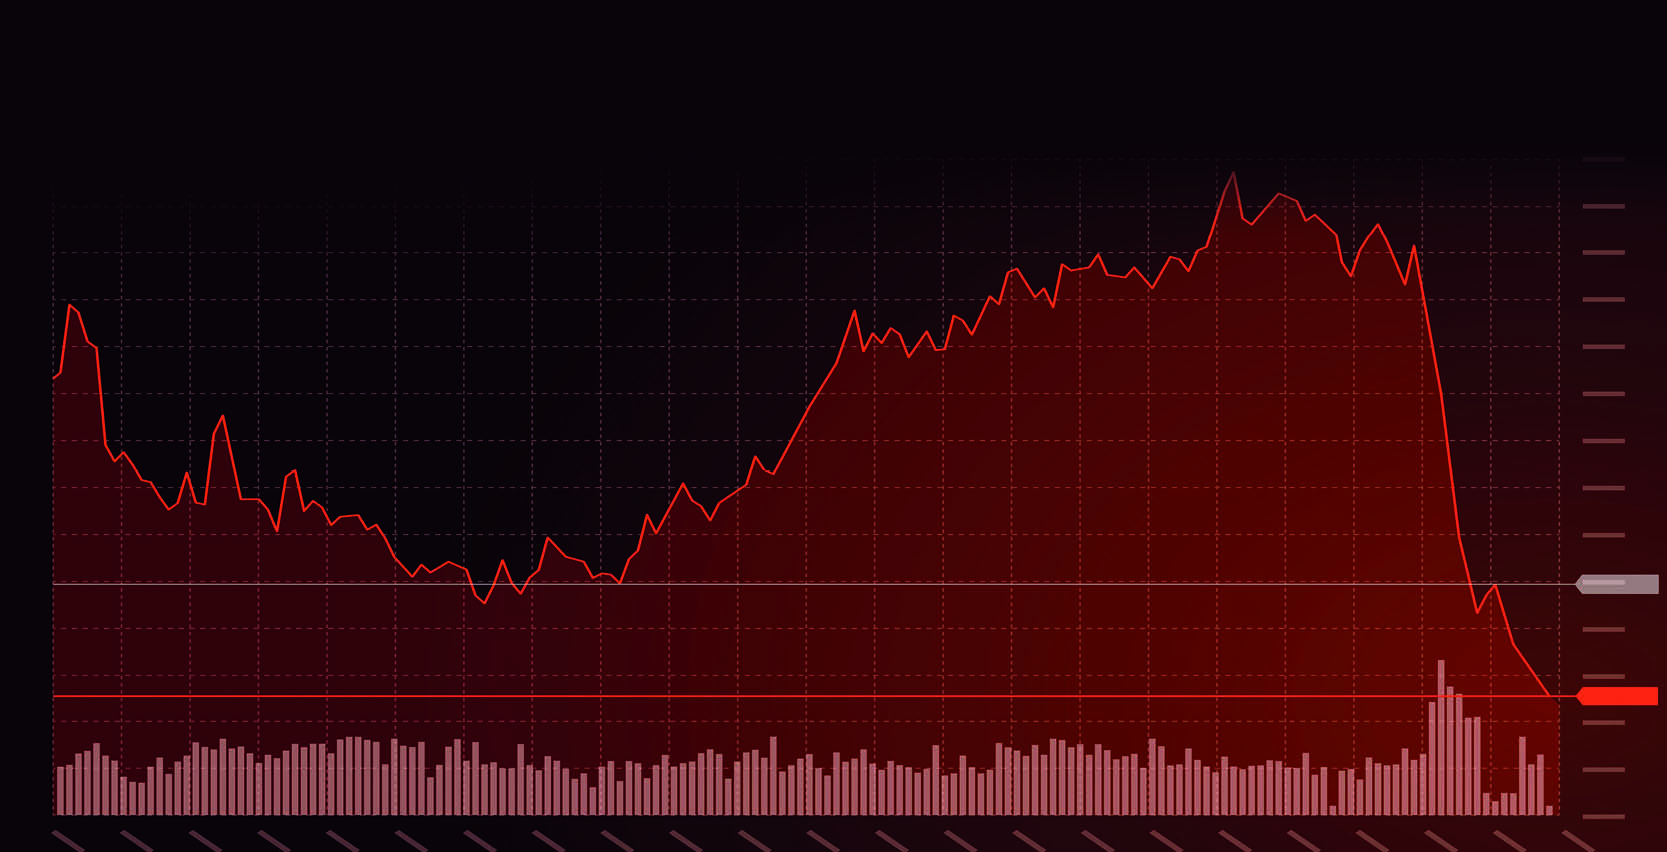
Dewan Housing Finance Corporation Limited, better known as DHFL, was once one of India’s leading housing finance companies, providing home loans and other retail lending products. At its peak, it was commanding a market value of approximately ₹21,600 crore.
A steep fall in a stock price can be tempting, but not every decline creates an opportunity. This article examines how investors can look beyond headline valuations, question market narratives, and distinguish temporary setbacks from deeper business problems before committing capital [EasyDNNnews:PaidContentStart]
A Stock That Keeps Falling Can Still Look Cheap
Dewan Housing Finance Corporation Limited, better known as DHFL, was once one of India’s leading housing finance companies, providing home loans and other retail lending products. At its peak, it was commanding a market value of approximately ₹21,600 crore.
DHFL’s decline began when the 2018 IL&FS crisis made lenders increasingly cautious about financing housing finance companies. The immediate trigger was the sale of DHFL debt by a Mutual Fund at an unusually high yield, which raised doubts about the company’s ability to raise money. Since DHFL had funded long-term housing loans partly through borrowings that required frequent repayment or refinancing, the drying up of fresh funding created a severe liquidity mismatch. What initially appeared to be market panic was later followed by rating downgrades, payment defaults, and governance concerns.
Once the share price of the company started falling, at every stage of its decline, the stock looked cheaper than it had a few months earlier. Investors who remembered its previous highs could easily believe they were buying the same company at a steep discount. But the falling price was not creating value. It was reflecting worsening liquidity, mounting defaults, and a business that was gradually collapsing.
This is the trap many investors fall into during a market correction. When a stock falls from ₹500 to ₹150, the arithmetic is seductive: a 70 per cent discount, surely too good to pass up. But the old price of ₹500 was never a certificate of value. It was simply the last point at which buyers and sellers agreed to trade the stock, based on what they knew, hoped, and feared at the time. When share prices fall sharply, the biggest losers can look like the biggest opportunities. But a lower price does not automatically mean better value. Sometimes the market is being irrationally fearful. Just as often, it is correctly pricing in a business that is genuinely getting worse.
To find out which explanation usually wins, we studied what happened after 12 market corrections in India since 2007 and then checked the story against the real financial statements of six well-known Indian companies. The aim was not to prove that every fallen stock is doomed, or that every rebound is deserved, but to work out how an ordinary investor can tell the two apart before committing real money.
How We Tested It
We used the Nifty 500, the broadest slice of investable Indian equity, covering about 92 per cent of NSE's free-float market value, and its equal-weighted total-return index. Equal weighting matters: in a normal, market-cap-weighted index, a handful of giant companies can mask what is happening to hundreds of smaller, weaker ones. A giant compounder having a good year can make an entire index look healthy even while most of its constituents are struggling. Weighting every stock the same way gives a clearer view of the market beneath the surface, which is exactly where the 'fallen stock' question actually lives.
Since 2007, this index has been through corrections ranging from brief 12–13 per cent dips to a 71 per cent collapse during the 2008 global financial crisis and a 57 per cent fall around the Covid crash. For each of the 12 corrections we studied, we picked an ‘action date’, the first point at which the index had fallen 10 per cent from its recent peak. Think of the action date as the moment a nervous investor might realistically decide to start bargain-hunting: the market has clearly turned down, but nobody yet knows how deep the fall will go.

On that date, we split every Nifty 500 stock into ten equal groups, or deciles, based on how each stock had performed over the previous year. D1 held the weakest pre-crash performers, the stocks that had already been falling before the wider market turned. D10 held the strongest, stocks that had held up well, or even risen, while the broader market was still calm. We then tracked what each of these ten groups did, as a group, over the following year, using the median return so that one or two extreme winners or losers could not distort the overall picture.
This design mirrors what an investor actually experiences. Nobody gets to look back from the bottom of a crash and buy with perfect hindsight. They have to decide, in the middle of falling prices and uncertain headlines, whether today's biggest losers deserve a second look.
What We Found
The results challenge the popular belief that the stocks which fall hardest in a crash make the best bargains once the market turns.
Across all 12 corrections, D1, the weakest pre-crash group, was the worst performer in eight of them. The stronger pre-crash groups, D6 to D10, produced the best-performing decile in nine of the 12 corrections. And D8 beat D1 outright in 11 of the 12 episodes.
D8 Beat D1 in 11 of 12 Recoveries
The gap was not trivial. D8 outperformed D1 by an average of 13.7 percentage points over the following year. Exclude the unusual post-Covid rebound, and that gap widens to 20.9 percentage points.

D1 did not just recover the least; its results were also the most unpredictable. Buying the weakest stocks after a crash meant living with both lower typical returns and a much higher chance of a very bad outcome.
Could this simply be luck, given there were only 12 corrections to study? We tested it with a method called the Wilcoxon signed-rank test, which checks whether one group consistently beat another across many separate episodes without assuming returns follow any particular statistical pattern. For the full sample, the odds of seeing a gap this consistent purely by chance were about 3.4 per cent. Strip out the Covid rebound, an unusual, liquidity-driven rally that lifted almost everything, including the weakest names, and the odds fall to about 0.1 per cent. A separate check, measuring how much each step up the decile ladder was worth in extra return, told the same story: excluding Covid, moving up one decile was worth roughly 1.5 percentage points of additional one-year return, a relationship unlikely to be random.
None of this predicts any single stock's fate; these are broad, group-level patterns, not a guarantee for any one company. And they come with an important caveat.
Not Every Fallen Stock Is The Same Kind Of Fallen Stock
Before going further, it helps to be precise about what the deciles actually measure, because the language around this subject gets loose very quickly. D1 is not a list of ‘cheap’ stocks. It is a list of stocks that had already underperformed the market before the crash began. A stock can fall a great deal and still be expensive relative to its earnings; it can fall only a little and be genuinely undervalued; or it can look cheap simply because a one-off item flattered its earnings the year before. Similarly, D6 to D10 are not ‘quality’ stocks, they are simply stocks that had shown relative price strength. That strength might reflect real improvements in the business, or it might just as easily reflect an expensive valuation riding pure momentum. The decile ranking says nothing directly about debt, profitability, or governance; it only measures where the price had already been heading.
With that caveat in mind, a stock trading well below its old high generally falls into one of three buckets. The first is temporarily mispriced: the underlying business is intact, and the market has simply overreacted to short-term noise, a sector-wide scare, or forced selling that had nothing to do with the company's own prospects. These are the genuine bargains, and, in real time, the hardest to identify with any confidence. The second is fundamentally impaired: the fall reflects a real and possibly permanent deterioration in the business, lost customers, a broken balance sheet, a disrupted business model, or management that has lost the market's trust. Buying here is buying a value trap, however statistically cheap the multiple looks on a screen. The third is a turnaround candidate: the business was genuinely damaged, but it is being actively repaired, through deleveraging, a cyclical upswing in its industry, or a real operational fix, and the market has not yet caught up with the improvement. These can be the most rewarding investments of all, but only when the repair shows up in the numbers first, rather than being assumed on faith.
Why Investors Keep Falling For It
If the odds are stacked against blindly buying the biggest losers, why do investors keep doing it? Part of the answer is not a market failure at all. It is human psychology, and it has been studied for decades.
The Nobel-winning psychologists Daniel Kahneman and Amos Tversky showed that people evaluate outcomes relative to a reference point, and feel losses far more intensely than equivalent gains, a bias known as loss aversion. In investing, the reference point is almost always the price we originally paid, or the old high we remember. A stock that has fallen from ₹500 to ₹150 does not register as ‘a business that may have lost most of its earning power’; it registers as ‘a ₹350 discount’. Kahneman later described the effect neatly: the mind struggles to recognise that two framings of the same fact are logically identical. ‘Down 70 per cent from the high’ sounds like an opportunity. ‘A business that has lost most of its earning power’ sounds like a warning. Investors hear the first sentence far more readily than the second, even when both describe exactly the same stock.
The economist Terrance Odean gave this bias its practical, trading-floor expression. Studying real brokerage accounts, he found investors were markedly more willing to sell their winners than their losers, in his data, a gain was roughly 60 per cent more likely to be sold than a loss of similar size. This is the disposition effect: selling a loser makes the loss final and undeniable, so investors avoid it, often by holding on or by buying more of the falling stock to lower their average cost. Averaging down feels like discipline. In a business that is genuinely deteriorating, it is often just a slower way of losing more money.
There is also a kernel of truth that investors over-extend. Research by Narasimhan Jegadeesh and Sheridan Titman found that buying stocks with strong recent performance and avoiding recent losers produced positive excess returns over three-to-twelve-month horizons, a pattern known as momentum, and one that shows up in Indian stock data too. Momentum is real, and it is not simply crowd behaviour; it can reflect improving earnings, better management, or growing confidence in a business before that improvement is fully priced in. But investors often assume the mirror image must also be true: that a stock which has fallen a long way must be ‘due’ for an equally sharp bounce.
Finally, there is a sobering statistic about where stock-market wealth actually comes from. Research by the finance professor Hendrik Bessembinder, tracking nearly a century of U.S. market data, found that only a minority of listed stocks ever beat the return on safe government bills over their lifetime, and that a strikingly small number of exceptional companies account for the majority of all the wealth the stock market has ever created. In other words, markets get rich because a small set of durable, well-run businesses compounds relentlessly, not because the average broken business eventually heals itself. Buying every stock that looks cheap, hoping each one is a hidden compounder, works against those odds rather than with them. This is equally applicable in the Indian market too.
Put simply: a low share price can be a warning sign as easily as it can be an opportunity. The only way to tell them apart is to look at what actually broke, not at how far the price has fallen.
What Really Happened: Six Indian Companies, In Their Own Numbers
A crash can shrink a stock's price. It cannot repair a weak balance sheet, undo poor governance, or revive a business model the market has already moved past. The financial statements of three well-known Indian companies show exactly how that plays out, and three others show what a genuine recovery looks like instead.
Where the falling price was telling the truth

In each case, the falling share price was not a sign the market had overreacted, it was catching up with a deteriorating reality. Yes Bank's bad loans and capital shortfall were real and had been underreported for years; the RBI eventually removed its board, placed the bank under a formal moratorium on March 5, 2020, and reconstructed it within days under a scheme notified by the government. The bank itself survived, deposits were protected, and it later returned to profitability, but holders of its Additional Tier 1 bonds faced a complete write-down that remains contested in court, and ordinary shareholders were left holding a permanently diluted claim on a much smaller, much safer bank. Institutional survival, in other words, does not automatically mean shareholder recovery.
DHFL followed a similar arc from a different starting point. Once a well-regarded housing financier, it defaulted on its obligations, and the RBI removed its board in November 2019 amid governance failures and a widening funding crisis. The stock eventually fell more than 97 per cent from its peak. It was resolved not through a market rebound but through India's insolvency process: the Piramal Group acquired it for ₹34,250 crore in a resolution plan that was contested all the way to the Supreme Court, with lenders recovering under half of what they were owed. Reliance Communications tells the starkest version of the same story. Once one of India's largest telecom operators, it was undone by a mountain of debt and the arrival of a disruptive new competitor; it shut its core voice business in 2017 and filed for bankruptcy in 2019, with debt of roughly ₹57,000 crore against assets of about ₹18,000 crore. None of these three stocks were ever cheap in any sense that mattered. They were priced exactly as expensively as their deteriorating businesses deserved, the falling price was simply arriving before most investors were willing to accept the news.
Where the recovery was real

Suzlon's story shows what a genuine turnaround requires. Once a byword for over-leveraged renewable-energy ambition, the company spent years cutting debt, rebuilding its Order Book past 6 GW, and returning to sustained profitability, improvements that were visible in its balance sheet years before the stock re-rated. Even so, the turnaround carries a caveat worth remembering: SEBI later fined the company over past misreporting, a reminder that a business can genuinely improve while still carrying old governance baggage. Titan sits slightly outside this test altogether, because it rarely traded 'cheap' in the first place by any conventional measure; its steady, multi year climb reflects a durable jewellery and lifestyle franchise, strong brand equity, and consistent execution rather than a rebound from distress, a useful reminder that the highest quality compounders often never offer investors the kind of drawdown this study examines. Tata Motors recovered because its underlying business genuinely improved: profitability at Jaguar Land Rover strengthened, commercial-vehicle margins recovered, and the group's automotive operations moved from meaningful net debt to a net cash position, not because the shares had simply been depressed for long enough that a bounce became statistically inevitable.

The pattern across both tables is the same. A falling share price is only a number. A genuine turnaround shows up first in revenue, profit, cash flow, and debt, and only later, once the market notices, in the stock price. Waiting for the numbers costs an investor some of the upside. Skipping that step is how value traps get bought.
What It Means For Investors
This matters more than ever, because the audience for this mistake has never been larger. NSE says its unique registered investor base crossed 13 crore in April 2026, a number that has roughly doubled in a few short years, driven by easy digital onboarding, a generation of new investors who have never lived through a prolonged bear market, and a culture of financial content that often celebrates the sharpest possible price falls as the loudest possible buying signals. More people than ever are watching Indian markets fall, and more of them than the industry would like to admit are treating every crash like a clearance sale, without asking what, exactly, is on sale.
Before buying a stock purely because it has fallen, it helps to work through a short, disciplined list of questions rather than relying on the size of the discount alone:
1. What has actually broken here, sentiment, or the business itself? If the honest answer is only sentiment, the stock may genuinely be mispriced. If the answer touches debt, governance, customers, or competitive position, the lower price is not a gift; it is the bill arriving.
2. Can the balance sheet survive another bad year without rescue capital? A company that needs everything to go right from here is a much riskier bet than one that can absorb a further shock. 3. Did the company need emergency equity issuance, asset sales, or external rescue to stay afloat? Each of these is a signal that the original shareholders are being diluted or subordinated to keep the business alive, institutional survival is not the same as shareholder recovery, as Yes Bank showed.
4. Is the pressure cyclical, or structural and possibly permanent? A cyclical downturn ends when the cycle turns. A structural one, like Reliance Communications facing a disruptive new competitor, does not end on its own.
5. Has management responded to stress with candour, or with denial? Companies that acknowledge problems early and set out a credible plan behave very differently from those that keep insisting nothing is wrong until the regulator intervenes.
6. How did the stock behave before the crash, resilience, or a long prior decline? This is exactly what the decile study measures, and it is informative precisely because it is so easy to check.
7. Is the low multiple attached to resilient cash generation, or to earnings that are still shrinking? A stock can look statistically cheap on last year's earnings while those earnings are actively falling, which is not cheap at all, just lagging.
The Bottom Line
None of this means every fallen stock is a trap, or that every rebound is undeserved. Suzlon proves real turnarounds happen, and they happen in India, in companies investors had already given up on. It also proves how demanding they are to spot in advance: a genuine turnaround needs improving revenue, profit, cash flow, and debt, visible in the financial statements, not just a hopeful chart pattern or a large enough discount from the old high.
The single most dangerous number on a stock screen may be the percentage fall from the high. It is vivid, easy to understand, effortless to sort a screener by, and often deeply misleading. Prices fall because value disappears, because panic takes over, or because both happen at once, and telling those two cases apart is the entire job of a careful investor.
Across 12 Indian market corrections and six real companies, the evidence points the same way: a falling price should be the start of an investigation into what changed in the business, not the end of one, and certainly not a reason to buy on its own.
[EasyDNNnews:PaidContentEnd] [EasyDNNnews:UnPaidContentStart]
To read the entire article, you must be a DSIJ magazine subscriber.
[EasyDNNnews:UnPaidContentEnd]