How to Analyse Quarterly Results: A Practical Guide for Stock Investors
Rithvik / 27 Jul 2026 / Categories: Knowledge, Trending
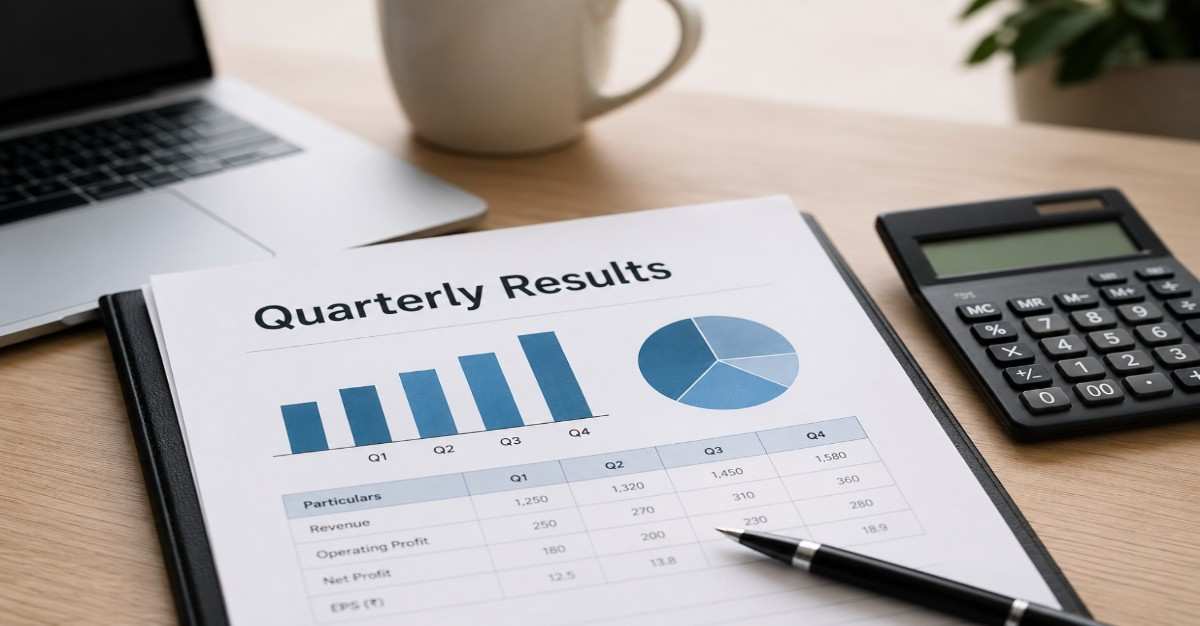
A Practical Guide to Understanding Revenue, Profit, Margins and Cash Flow
Quarterly Results provide investors with a regular update on a company’s financial health, operating performance and business momentum. Every listed company publishes its results four times a year, allowing shareholders to assess whether revenue, profitability, margins, cash generation and debt levels are moving in the right direction.
However, analysing quarterly results is not simply about checking whether profit increased or declined. A company may report strong profit growth due to a one time gain, while its core business remains weak. Similarly, a temporary fall in earnings may not be a major concern if the business is investing in expansion or facing normal seasonal pressure.
Investors should therefore evaluate quarterly results in the context of the company’s business model, industry cycle, past performance and management guidance.
Start With Revenue Growth
Revenue, also known as sales or income from operations, shows how much money the company generated from its core business during the quarter.
Investors should compare revenue on both a year on year and sequential basis. Year on year comparison measures performance against the corresponding quarter of the previous financial year. Sequential comparison measures performance against the immediately preceding quarter.
Year on year growth is generally more useful for businesses affected by seasonality. For example, consumer companies may record stronger sales during festive quarters, while cement companies can experience weaker demand during the monsoon period.
Investors should also identify the reason behind revenue growth. Sales may increase because of higher volumes, better pricing, new capacity, acquisitions, market share gains or favourable currency movements.
Volume led growth is usually considered healthier because it indicates stronger demand. Price led growth may support revenue temporarily, but it can weaken if customers resist higher prices.
Examine Operating Profit and Margins
Operating profit reflects the earnings generated from the company’s main business before accounting for interest, Tax, depreciation and certain non operating items. It is commonly referred to as EBITDA.
The EBITDA margin is calculated by dividing EBITDA by revenue and multiplying the result by 100.
For example, if a company reports revenue of ₹1,000 crore and EBITDA of ₹200 crore, its EBITDA margin is 20%.
A rising margin may indicate better pricing power, lower input costs, improved efficiency, operating leverage or a favourable product mix. A falling margin may suggest higher raw material costs, employee expenses, marketing expenditure or price competition.
Margins should always be compared with the company’s historical range and those of its peers. A single quarter of margin expansion may not be sustainable, particularly if it is caused by temporary changes in commodity prices.
Investors should also check whether profit growth is higher or lower than revenue growth. When operating profit grows faster than revenue, it may indicate operating leverage. When revenue rises but operating profit falls, cost pressures may be increasing.
Understand the Movement in Net Profit
Net profit is the amount remaining after deducting operating expenses, depreciation, interest, tax and other costs.
Although net profit is important, it should not be analysed in isolation. Investors must determine whether profit growth came from the core business or from exceptional items.
A company may report a sharp increase in profit because of the sale of land, an investment gain, a tax reversal or compensation received through a legal settlement. Such income may not recur in future quarters.
Similarly, profit may decline because of an exceptional loss, impairment charge or higher depreciation following the commissioning of a new plant.
Investors should compare profit before exceptional items with the reported profit after tax. This helps reveal the underlying earnings trend.
Check Interest Costs and Debt
Interest expense shows how much the company paid on its borrowings during the quarter. A sharp rise in interest costs may indicate that debt has increased or borrowing rates have moved higher.
For highly leveraged businesses, even moderate pressure on revenue can significantly affect profit because interest payments must still be made.
Investors should review the company’s total debt, debt to equity ratio and interest coverage ratio. The interest coverage ratio measures how comfortably operating profit can cover interest costs.
A declining interest coverage ratio may be a warning sign, particularly when the company is also facing weak cash flow or falling margins.
However, an increase in debt is not automatically negative. Borrowing may support capacity expansion, acquisitions or working capital requirements. The key question is whether the new investment is likely to generate sufficient returns.
Review Cash Flow and Working Capital
Quarterly profit does not always translate into cash. A company may report growing earnings while struggling to collect payments from customers.
Investors should examine cash flow from operations whenever quarterly cash flow information is available. Over a longer period, operating cash flow should broadly support reported profit.
Receivables, inventories and payables also deserve attention. A sharp increase in receivables may indicate delayed customer payments. Rising inventory may signal weaker demand or deliberate stock building ahead of a strong season.
Some industries naturally require more working capital than others. Therefore, changes should be compared with the company’s own historical pattern and business cycle.
Study Segment Performance
Diversified companies often operate across several business segments. Consolidated revenue and profit may hide major differences between these divisions.
For example, one segment may be growing rapidly while another is experiencing margin pressure. Investors should review segment wise revenue, profit and capital employed to understand which division is driving performance.
Segment analysis can also reveal whether the company is becoming dependent on a single product, geography or customer category.
For Banks and financial companies, investors should focus on metrics such as loan growth, net interest margin, gross non performing assets, net non performing assets, credit costs and capital adequacy.
Compare Results With Market Expectations
A company can report strong growth and still see its share price decline if the results fall below market expectations. Similarly, weak reported numbers may be followed by a price rise if investors had expected an even worse performance.
Therefore, investors should distinguish between absolute performance and performance relative to expectations.
Management commentary, analyst estimates and the company’s previous guidance can help assess whether the results were ahead of, in line with or below expectations.
However, investors should avoid making decisions solely on the immediate share price reaction. Markets can initially overreact to both positive and negative announcements.
Read Management Commentary Carefully
Management commentary provides information that may not be visible in the financial statements. It can explain demand conditions, raw material trends, capacity utilisation, order inflows, pricing, expansion plans and expected margins.
Investors should compare management statements with actual performance over subsequent quarters. Repeated delays in projects, frequent changes in guidance or overly optimistic commentary may require greater caution.
Conference call transcripts and investor presentations can be particularly useful. They allow investors to understand the reasons behind major changes and evaluate the quality of management responses.
Look Beyond a Single Quarter
One quarter rarely defines the long term direction of a business. Temporary factors such as seasonality, plant shutdowns, delayed orders, commodity price movements or regulatory changes can affect short term performance.
Investors should study at least eight to twelve quarters of financial data to identify trends in revenue, margins, profit, debt and cash flow.
Consistent improvement is generally more meaningful than an isolated quarter of exceptional growth.
The final assesSMEnt should answer a few basic questions. Is the business growing? Are margins stable or improving? Is profit supported by cash flow? Is debt manageable? Is management delivering on its commitments?
Quarterly results are most useful when viewed as part of a continuing story. By connecting the numbers with business developments, industry conditions and management commentary, investors can make a more balanced assessment of a company’s financial progress.