How To Identify A Market Bubble
Ninad Ramdasi / 04 Apr 2024 / Categories: DSIJ_Magazine_Web, DSIJMagazine_App, Special Report, Special Report, Stories
This article by Vaishnavi Chauhan elucidates how by prioritising fundamentals, maintaining a long-term perspective and resisting emotional impulses, investors can navigate market bubbles more effectively and safeguard their portfolios against unnecessary risks
While explaining the term ‘market bubble’, this article by Vaishnavi Chauhan elucidates how by prioritising fundamentals, maintaining a long-term perspective and resisting emotional impulses, investors can navigate market bubbles more effectively and safeguard their portfolios against unnecessary risks
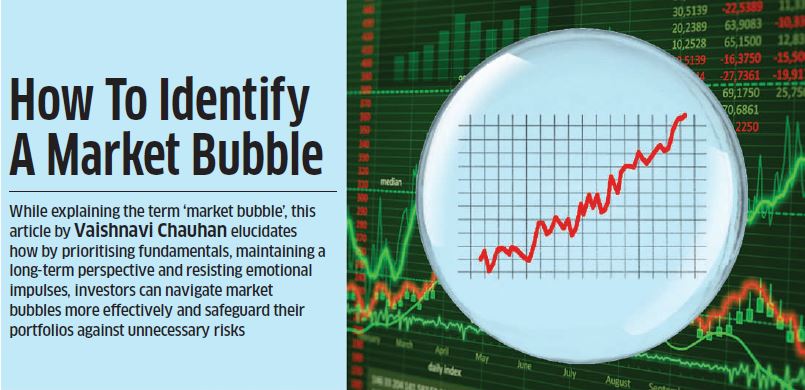
The term ‘market bubble’ has been making rounds on Dalal Street for a while. Let’s understand what it means and how it actually works. A stock market bubble refers to a situation where stock prices are driven to high levels by speculative buying, often far exceeding the intrinsic value of the underlying assets. During a bubble, investors buy stocks based on the expectation that prices will continue to rise, rather than on the fundamental value of the companies. This can lead to unsustainable price increases, fuelled by excessive optimism and speculation. Eventually, the bubble bursts when investors realise that the stock prices are not justified by economic fundamentals, leading to sharp declines in prices and significant market corrections.
South Sea Bubble
Taking a tour back in time. During the early 1720s, Europe experienced the South Sea Bubble, a financial phase revolving around the South Sea Company, which held exclusive trade rights to South America. Promising vast riches from this trade, the company’s stock price soared, fuelled by speculation and media hype. Even Sir Isaac Newton, renowned physicist and mathematician, was drawn into the allure of quick wealth. Initially, Newton invested wisely and profited. [EasyDNNnews:PaidContentStart]
However, enticed by the escalating gains, he poured a substantial portion of his wealth, possibly up to £ 20,000, into the company. And, like all bubbles, the South Sea Bubble eventually burst in 1720, resulting in significant losses for many, including Newton. Legend suggests that Newton, upon realising his mistake, lamented, “I can calculate the movement of the stars, but not the madness of men.” While the historical accuracy of this quote is debated, it encapsulates the essence of the situation.

As we delve deeper into understanding market bubbles, it’s essential to consider whether they are exclusive to the stock market. The reality is that bubbles can form across various asset classes, not just in stocks.
1. The Dutch Tulip Bubble
The ‘tulip’ mania that swept through Holland in the 1630s is one of the earliest documented instances of an irrational asset bubble. During this period, tulip prices surged dramatically, increasing twentyfold between November 1636 and February 1637. However, this meteoric rise was short-lived, with prices plummeting by a staggering 99 per cent by May 1637, as reported by former UCLA economics professor Earl A. Thompson. Tulipmania affected a broad spectrum of Dutch society, with some tulip bulbs commanding prices surpassing those of entire houses at the peak of the frenzy.
2. Japan’s Real Estate and Stock Market Bubble
In modern times, asset bubbles are sometimes driven by overly aggressive monetary policies. A quintessential example is Japan’s economic bubble of the 1980s. Triggered by a 50 per cent surge in the yen’s value during the early 1980s, Japan experienced a recession in 1986. To counteract this downturn, the government implemented a combination of monetary and fiscal stimulus measures. However, these policies inadvertently led to rampant speculation, causing Japanese stocks and urban land values to triple between 1985 and 1989. At the pinnacle of the real estate bubble in 1989, the value of the Imperial Palace grounds in Tokyo surpassed that of all real estate in the state of California. The bubble eventually burst in 1991, ushering in a period of price deflation and economic stagnation known as Japan’s Lost Decade.
3. The Dot-Com Bubble
The dot-com bubble of the 1990s was characterised by an unprecedented surge in speculation surrounding internetbased businesses. During this period, the rapid growth of the internet led to a frenzy of investment in ‘new economy’ companies, resulting in sky-high valuations for many dot-com start-ups. The NASDAQ Composite index, which primarily comprised technology and dot-com stocks, skyrocketed from around 750 points in early 1990 to over 5,000 by March 2000. However, the bubble burst soon after, with the index plummeting by 78 per cent by October 2002, sparking a recession in the United States. It took over 15 years, until 2015, for the index to reach a new peak after the collapse of the dot-com bubble.
4. The U.S. Housing Bubble
Following the bursting of the NASDAQ dot-com bubble, many U.S. investors shifted their focus to real estate, mistakenly perceiving it as a safer investment. From 1996 to 2006, U.S. house prices nearly doubled, with a significant portion of this increase occurring between 2002 and 2006. However, signs of an unsustainable frenzy emerged, including widespread mortgage fraud and speculative practices like condo flipping. The housing bubble peaked in 2006, followed by a rapid decline that saw the average U.S. house lose one-third of its value by 2009. The collapse of the housing market, coupled with the ripple effects on mortgage-backed securities, triggered a global economic contraction known as the Great Recession, the most significant since the 1930s Depression.
These historic bubbles underscore the importance of recognising warning signs and exercising caution in investment decisions, as well as the profound impact that burst bubbles can have on economies worldwide.
Bubble Formation

As we explore the concept of bubbles, it’s crucial to examine their phases and cycles. Looking back at the history of the stock market, we can observe numerous instances where such phenomena were triggered:
◼ Stealth Phase: Beginning around 2000 and lasting until October 2001, this phase saw subtle market changes unnoticed by most. Risk-aware investors recognised emerging opportunities, though the market rise was slow and unpredictable.
◼ Awareness Phase: Spanning from October 2001 to mid-2005, this phase witnessed increased investor awareness of market momentum and potential. Additional investments flowed in, driving overall market growth. Despite substantial gains, the first market dip occurred around May 2004, causing initial panic.
◼ Mania Phase: Starting around 2005 and ending in early 2008, this phase witnessed widespread recognition of market changes, even among the general public. Media attention peaked, reflecting market frenzy and speculation.
◼ Blow-Off Phase: The bubble burst in January 2008 triggered a significant market panic. Confidence levels plummeted with a brief phase of denial before the real downturn began. Despite temporary reassurances, the market experienced a sharp decline, returning to its mean.
This historical market analysis highlights recurring patterns, indicating that similar market cycles have occurred before.
Identifying a Bubble
Identifying a stock market bubble in its nascent stages poses an ongoing challenge for investors. Yet, by discerning the warning signs and common pitfalls, one can bolster awareness and make more informed investment decisions. Here’s a comprehensive breakdown of how to spot a potential stock market bubble:
Excessive Valuation Metrics
1. High PE Ratios: A critical metric to scrutinise is the price-to-earnings (PE) ratio, juxtaposing a company’s stock price against its earnings per share. A soaring PE ratio, notably surpassing historical averages or industry benchmarks, may signal an overvalued stock or a market verging on bubble territory.
2. Shiller CAPE Ratio: This cyclically adjusted PE ratio adjusts for inflation, furnishing a more nuanced, longer-term view of valuation. An elevated CAPE ratio across the broader market suggests potential bubble conditions.
Unsustainable Price Movements
◼ Rapid Price Escalation: Escalating stock prices divorced from underlying fundamentals such as earnings or revenue growth can ring alarm bells.
◼ Short-Term Gain Focus: When investor sentiment fixates on short-term profits at the expense of a company’s long-term viability, it can inflate prices beyond sustainable levels. Day trading and a speculative ‘get rich quick’ ethos often dominate during bubble phases.
Spotting a Bubble with Technical Analysis
Technical analysis, also known as charting, is a method used to analyse a stock’s price movements over time in order to understand market behaviour. When examining a potential bubble, analysts look for specific patterns in price growth, trading volume, and volatility. A key indicator of a potential bubble is exponential price growth, often accompanied by increasing trading volume and volatility. This upward trend suggests strong momentum in the market, which may continue as long as these factors continue to rise steadily.
However, a sudden reversal in price, especially if it closes significantly lower than its session high, along with a surge in trading volume and volatility, could indicate a ‘blow-off top’. This occurs when insiders begin selling to latecomers, who are now at risk of significant losses as prices plummet without insider support. Another warning sign is when trading volume and volatility sharply contract, indicating a lack of interest from buyers and anxious sellers trying to secure profits or limit losses. Professional traders may even short the stock, further exacerbating the decline in prices.
Market breadth indicators, which measure the participation of stocks within an index and assess the strength of a price trend, can also provide valuable insights into potential bubbles. For instance:
◼ A strong uptrend in a market index with weak breadth, where the number of advancing stocks remains low, could indicate that the uptrend is not broadly supported and may be nearing exhaustion.
◼ Persistent divergence between a rising price index and a declining breadth indicator may signal a potential bubble, suggesting that the index’s rise is driven by a limited number of stocks, and the overall market health might be weaker than perceived.
Utilising a combination of fundamental and technical methods can enhance investors’ ability to identify market bubbles.

"Most people get interested in stocks when everyone else is. The time to get interested is when no one else is. You can't buy what is popular and do well. "
-Warren Buffett
Avoid Market Bubble
Avoiding market bubbles entirely is challenging due to their unpredictable timing. However, adopting a cautious and informed approach can significantly mitigate the risk of getting caught in the hype. Here are some key strategies to consider:
1. Focus on Fundamentals
◼ Prioritise Strong Financials: Invest in companies with robust financial health, consistent earnings growth, and a sustainable business model. Avoid companies with minimal profits or unrealistic future projections driven by hype.
◼ Value Investing: Seek out companies whose stock prices trade below their intrinsic value based on fundamental analysis. This approach helps avoid chasing inflated prices during bubbles.
◼ Diversification: Spread investments across different asset classes and sectors to reduce exposure to any single bubble and mitigate risk.
2. Maintain a Long-Term Perspective
◼ Invest for the Long Haul: Focus on companies with solid long-term growth prospects rather than chasing shortterm gains. Avoid succumbing to the ‘get rich quick’ mentality prevalent during bubbles.
◼ Resist Emotional Decisions: Stay disciplined during market fluctuations and resist the urge to panic sell or follow the crowd into overheated markets. Stick to your investment plan and avoid impulsive decisions driven by emotions.
[EasyDNNnews:PaidContentEnd] [EasyDNNnews:UnPaidContentStart]
To read the entire article, you must be a DSIJ magazine subscriber.
Current print subscribers click here to login
Subscribe NOW to get DSIJ All Access!
[EasyDNNnews:UnPaidContentEnd]