The Crystal Ball of Finance: How the Bond Market Predicts the Future
DSIJ Intelligence / 19 Jun 2026 / Categories: Knowledge, Trending
How the giant fixed-income market reads economic storms months before they hit the ground.
When people want to know where the economy is headed, they usually look at the stock market. They watch the Nifty 50 or the BSE Sensex flash green or red on the evening news, assuming that booming stock prices mean clear skies ahead.
But if you ask professional economists where they look for a glimpse into the future, they won't look at stocks. They look at the bond market.
While the stock market gets all the fame, the bond market is twice as large and widely considered the "smart money" in finance. It acts like a giant economic weather satellite, detecting storms months before they hit the ground.
By understanding one simple concept within the bond market, the yield curve, you can read these economic forecasts yourself. Here is how the bond market predicts the future, explained simply.
The Basics: What is a Bond Yield?
Before we can see how bonds predict the future, we need to understand how they work.
When a government or a corporation needs to borrow money, they issue a bond. When you buy a bond, you are lending them your money. In return, they promise to pay you back the full amount after a set period (say, 2 years or 10 years) and pay you interest along the way.
The annual return you get from holding that bond is called the yield.
The Golden Rule of Lending: The longer you tie up your money, the more interest you should expect to earn.
Think of it like a Bank Fixed Deposit (FD). If you lock your money away for just 3 months, the bank gives you a small interest rate. If you promise to lock it away for 10 full years, you expect a much higher interest rate because a lot can go wrong in a decade. Inflation could rise, or you might need that cash for an emergency.
The "Normal" Yield Curve
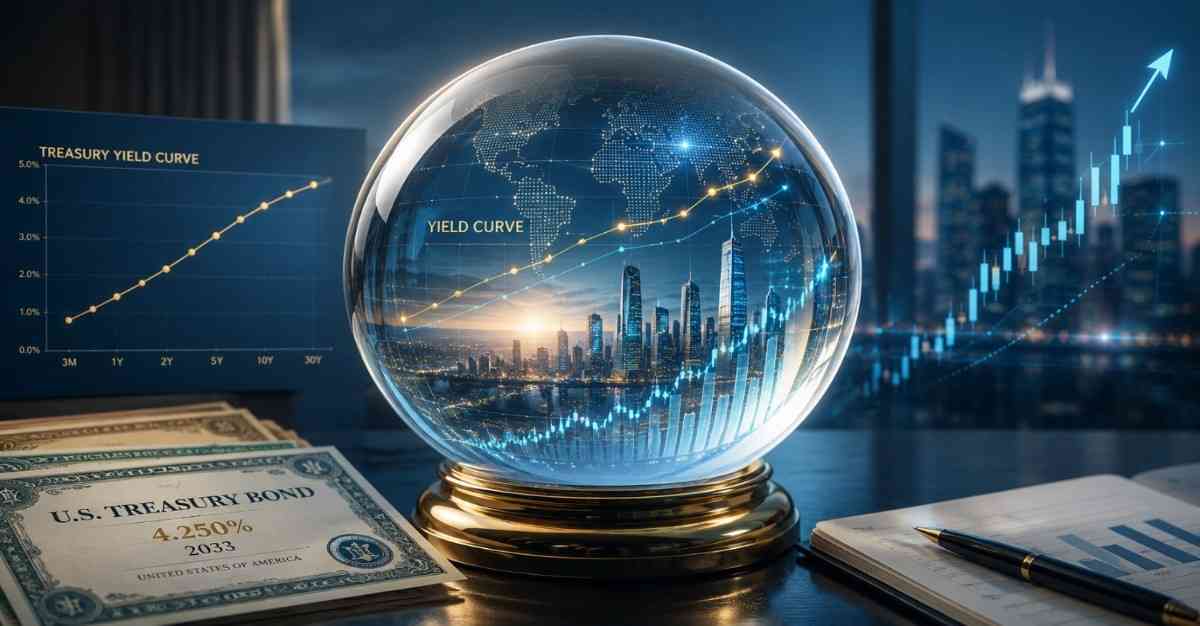
If you plot these interest rates on a graph, putting the time to maturity on the bottom line and the interest rate on the vertical line, you get the yield curve.
In a healthy, growing economy, this line slopes gently upward.
- Short-term bonds (3 months to 2 years) have low yields.
- Long-term bonds (10 to 30 years) have high yields.
This upward slope is normal because investors are optimistic about the future. They expect the economy to keep growing, companies to keep hiring, and inflation to hum along. Because they are confident, they demand a higher reward for locking their money up for the long haul.
The Inversion: Flipping the Curve Upside Down
Every now and then, something strange happens. The bond market begins to worry. Investors look at the horizon and see trouble, an economic slowdown, rising unemployment, or a stock market crash.
When investors get scared, they want to put their money somewhere completely safe for a long time. The safest place in the country is a long-term Indian Government Bond (commonly called a G-Sec).
Suddenly, thousands of investors rush to buy 10-year or 30-year G-Secs. In the bond market, when demand for a bond goes through the roof, its price goes up, but its yield goes down.
At the same time, because investors expect the Reserve Bank of India (RBI) to cut interest rates soon to fight the upcoming slowdown, they lose interest in short-term bonds. This causes short-term yields to stay high or even rise.
The result? The graph flips. Short-term bonds begin paying a higher interest rate than long-term bonds.
This phenomenon is called an Inverted Yield Curve.
A Real-World Example: The Lending Circle
Imagine you are lending money to two friends, John and Sarah.
- John wants to borrow Rs 1,000 and promises to pay you back next month.
- Sarah wants to borrow Rs 1,000 and promises to pay you back in 10 years.
In a normal world, you would charge Sarah a higher interest rate because 10 years is a long time to wait.
But what if you knew a massive economic storm was hitting your town next month, and you believed Sarah’s business was the only one that would survive it? Suddenly, you would feel much safer locking your money up with Sarah for 10 years than trusting John to pay you back next month. You might tell Sarah, "I'll take a lower interest rate from you, just please hold my money safely for the next decade."
That is exactly what the global bond market is doing when it inverts. It is signalling that the near future looks highly risky, while the distant future looks safer.
Why the Bond Market is the "Smart Money"
Why should we trust this upside-down graph? Because history shows it has an almost flawless track record as a global economic warning sign.
While an inverted yield curve has traditionally preceded major recessions in global economies, even in India, a flattening or inverted G-Sec curve is a powerful signal. It tells you that institutional investors are heavily pricing in a severe economic cooling period or an aggressive rate-cut cycle by the RBI.
Stocks are often driven by emotion, hope, greed, and retail hype. A company's stock can skyrocket overnight simply because of social media buzz or a trending headline.
Bonds, however, are driven by massive institutional investors, insurance companies, and pension funds. They deal in lakhs of crores of rupees, using sophisticated math rather than hype. When these giant players collectively move their capital into long-term safety, they change the shape of the yield curve, creating a warning siren for the rest of the financial world.
What Does This Mean for You?
You don't need a PhD in economics to benefit from the bond market's crystal ball. When you hear financial news mentioning that the G-Sec yield curve is flattening or inverting, you can use that knowledge to make smarter financial choices:
- Career Security: If the curve begins to flatten sharply, it might not be the best time to quit a stable corporate job to join a risky, cash-burning startup.
- Major Purchases: It might pay to delay a floating-rate home loan or a massive vehicle loan, as loan interest rates often drop when the central bank eventually cuts rates during the subsequent slowdown.
- Portfolio Balance: It serves as a reminder to ensure your investments are diversified, perhaps shifting some profits from volatile equities into stable debt Mutual Funds to weather a potential market downturn.
The bond market doesn't cause economic slowdowns; it simply reacts to the collective wisdom of the world's largest investors. By learning to read the yield curve, you can peek at the financial weather report and carry an umbrella before the first drop of rain falls.
Disclaimer: This content is for informational purposes only and not investment advice.