What Is the Put Call Ratio and How Should Investors Interpret It?
Rithvik / 01 Aug 2026 / Categories: Knowledge, Technical, Trending
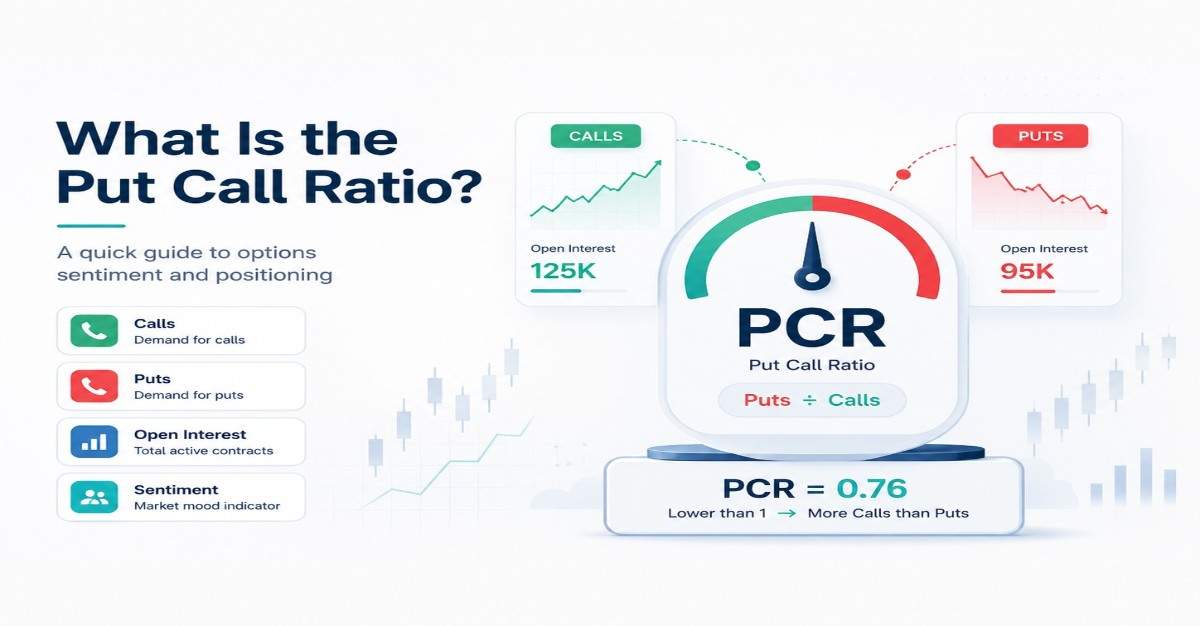
Understand how PCR measures options positioning and why high or low readings require proper context.
The Put Call Ratio is one of the most followed indicators in the derivatives market. It compares activity in put options with activity in call options and helps traders judge whether positioning appears defensive, bullish or excessively one sided.
However, the Put Call Ratio should not be treated as a direct buy or sell signal. Its meaning depends on whether it is calculated from open interest or volume, which expiry is studied and how the ratio changes with the underlying index.
What Is the Put Call Ratio?
The Put Call Ratio, commonly called PCR, measures put option activity relative to call option activity.
The open interest formula is:
Put Call Ratio = Total Put Open Interest divided by Total Call Open Interest
A volume based version is:
Volume PCR = Total Put Volume divided by Total Call Volume
NSE’s option chain displays call and put data including volume, open interest, strike price and implied volatility. Open interest represents outstanding contracts, while volume measures contracts traded during the session.
If put open interest is 12 lakh contracts and call open interest is 10 lakh, the PCR is 1.20. If put open interest is 7 lakh and call open interest is 10 lakh, it is 0.70.
How to Interpret PCR
A PCR above 1 means put open interest exceeds call open interest. A PCR below 1 means call open interest is higher.
More puts may appear bearish because investors buy them for protection or downside speculation. More calls may appear bullish because traders buy calls when expecting a rise.
The interpretation is not that simple because every option has a buyer and seller. Rising put open interest may come from put buyers expecting a fall or put writers expecting support. Call open interest may represent bullish buying or bearish writing.
PCR is therefore better viewed as a sentiment and positioning measure than a precise forecast.
Open Interest PCR Versus Volume PCR
Open interest PCR reflects positions that remain outstanding and can help show how traders are positioned for an expiry.
Volume PCR reflects current trading activity. It can change quickly during the session as participants react to news, prices or volatility.
Suppose open interest PCR remains near 1.00, but volume PCR rises to 1.50 during a market decline. This shows stronger put trading during the day, but it does not reveal whether traders are mainly buying or writing puts.
For positional analysis, open interest PCR may be more useful. Volume PCR can provide additional Intraday context.
Is a High PCR Bullish or Bearish?
A high PCR has 2 possible interpretations. It can appear bearish because put activity is greater. From a contrarian perspective, an extreme high may become potentially bullish if positioning has grown excessively negative.
A very low PCR can indicate strong optimism or heavy call positioning. An extreme low may warn that bullish expectations have become crowded.
There is no universal high or low level. An index may normally trade in a different PCR range from an individual stock. The relevant expiry, historical range and market conditions matter.
Reading PCR With Price
The direction of PCR can be more useful than one reading.
If an index rises while PCR increases, put writing may be building below the market and creating perceived support. If the index falls while PCR rises sharply, participants may be purchasing protection or positioning for further weakness.
If the index rises while PCR falls, call activity may be increasing faster. This could reflect call buying or call writing at higher strikes. Price, open interest changes and option premiums are needed to understand which activity is dominant.
A useful review asks: Is the underlying rising or falling? Is open interest being added or unwound? Are premiums increasing or decreasing?
Strike Wise and Expiry Wise Analysis
Market wide PCR combines many strikes and offers a broad view, but it may hide important positioning.
Heavy put open interest below the market may indicate a support zone, particularly when it comes from put writing. Heavy call open interest above the market may indicate resistance. These levels can shift quickly as positions are rolled or closed.
Weekly PCR may reflect short term trading, while monthly PCR may provide a wider view. Combining expiries without understanding their composition can mislead investors.
Limitations of PCR
PCR does not identify whether options are bought or written. It also does not measure the premium paid, risk size or whether a position is hedged with futures or other options.
Institutional strategies can increase both put and call open interest without expressing a simple directional view. Expiry related unwinding may also cause abrupt changes.
NSE’s advanced options material identifies the Put Call Ratio as an indicator used to study market swings, but it should not be used alone.
Key Takeaway
What is the Put Call Ratio? It is a comparison of put and call activity used to study market sentiment and derivatives positioning.
Investors should compare the current PCR with its historical range and combine it with price trend, volatility, premiums, support and resistance, and strike wise open interest. Extreme readings can provide useful context, but they are not automatic reversal signals.