APAR Industries Has Returned 2,678% in Five Years and 125% in the Past Year. Q1 FY27 Was the Best Quarter in the Company's History
 અમારી સાથે જોડાઓ
 અમને અનુસરો
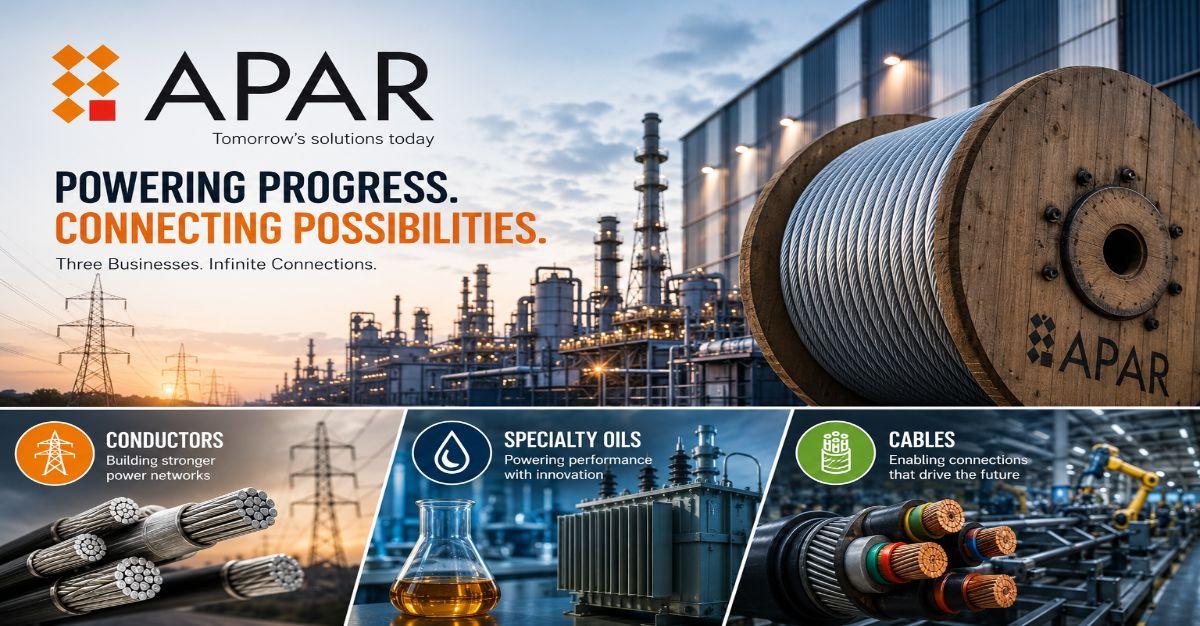
Three businesses, one record quarter. But the oil division margin that drove the headline needs to be read carefully before drawing conclusions about what is sustainable.
✨ મુખ્ય મુદ્દાઓ
In the last ten years, APAR Industries has returned 3,063 per cent. Over five years the return is 2,678 per cent. Over the past year it is 125.15 per cent — a multibagger. The 52-week high of Rs 18,432.40 was hit on August 12, 2026. The 52-week low of Rs 6,800 was touched on January 21, 2026. From that low, the stock has risen by approximately 160 per cent in just over seven months, taking it to more than 2.5 times its January level.
These are not the returns typically associated with a cables and conductors manufacturer. Understanding why they happened requires reading what APAR has become rather than what it was.
What APAR Actually Is
APAR Industries operates across three principal businesses: conductors, specialty oils and cables. Each has a different demand driver, margin profile and growth trajectory. Most investor analysis treats APAR as a conductor company with two smaller businesses attached. The Q1 FY27 numbers challenge that framing significantly.
Conductors — transmission conductors including premium HTLS and HTSC variants — contributed Rs 3,338 crore of Q1 FY27 revenue. Specialty oils — transformer oil, auto lubricants and industrial oils — contributed Rs 1,701 crore. Cables — power cables for utilities, Railways, Defence and data centres — contributed Rs 1,838 crore. Together, the three divisions accounted for roughly 51 per cent, 26 per cent and 28 per cent of Q1 FY27 revenue, respectively, for conductors, specialty oils and cables.
Q1 FY27: The Record Quarter
The consolidated headline numbers are exceptional.
|
Metric |
Q1 FY26 |
Q4 FY26 |
Q1 FY27 |
YoY Change |
|
Revenue (Rs crore) |
5104 |
6603 |
6591 |
29.1% |
|
EBITDA (Rs crore) |
501 |
584 |
814 |
62.7% |
|
EBITDA Margin |
9.80% |
8.80% |
12.40% |
+260 bps |
|
PAT (Rs crore) |
263 |
254 |
467 |
77.7% |
|
PAT Margin |
5.20% |
3.80% |
7.10% |
+190 bps |
Management stated explicitly on the call: "This incidentally is the highest quarterly sales as well as profit number that we have achieved in the history of the company." However, reading each division separately is essential before treating the consolidated margin as representative of the normalised business.
Conductor Division: The Structural Story
The conductor division is the heart of APAR's long-term investment thesis. Revenue grew 19.9 per cent year-on-year to Rs 3,338 crore in Q1 FY27. But the more important number is the EBITDA per tonne — Rs 53,418 in Q1 FY27 versus Rs 43,688 a year earlier, a 22.3 per cent improvement. Volume was actually down 6.7 per cent year-on-year at 53,279 MT — yet absolute EBITDA grew 14 per cent. Higher per-unit realisation from premium products more than compensated for lower volumes.
Management attributed the lower volumes to what it expects to be a temporary disruption in manufacturing clearances. A surge in aluminium prices caused certain customers particularly those on TBCB domestic projects without hedged metal to withhold manufacturing clearance on orders already placed. These orders exist in the book with contractual delivery timelines carrying significant penalties for delay.
The more structurally important development is the premium product mix. Premium products — HTLS conductors, copper transposed conductors, busbars, railway supplies — reached 50.3 per cent of conductor revenue in Q1 FY27, up from 43.7 per cent a year earlier. Premium products generally carry higher EBITDA per tonne than conventional conductors. As the mix has shifted, APAR's per-unit profitability has improved, suggesting a structural benefit from product mix rather than relying solely on volume growth.
The pending conductor Order Book stands at Rs 10,190 crore with 56.8 per cent from exports. New orders received in Q1 FY27 alone were Rs 5,245 crore — including two large orders exceeding Rs 2,800 crore combined from one major US utility and one European utility, with delivery schedules spread over four years. Management also received approval from one of the largest US utilities for OPGW with 144 fibre count — a technically significant product approval for the US market. APAR recorded its all-time highest reconductoring installations in Q1 FY27.
An order book of Rs 10,190 crore against FY26 conductor revenue of approximately Rs 13,000 crore provides strong visibility for the division, although the timing of conversion will depend on customer clearances, project schedules and metal-price conditions.
Oil Division: The Exceptional Quarter That Needs Honest Framing
The oil division EBITDA of Rs 329 crore in Q1 FY27 represents 214.2 per cent growth year-on-year. EBITDA per KL was Rs 25,482 versus Rs 7,004 a year earlier — a more than threefold increase. This is the primary driver behind the consolidated EBITDA jumping from 9.8 per cent to 12.4 per cent.
Management explained the mechanism directly on the call: APAR carries oil inventory procured under contracts at historical cost. When ICE gas oil prices rise sharply as they did in Q1 FY27 following the US-Iran conflict this can create a temporary inventory cost advantage when selling prices rise faster than the cost of inventory carried at earlier contracted prices. APAR recognised a provision of approximately Rs 93 crore for inventory valuation following the sharp movement in oil prices.
Management also acknowledged that when prices fall, the reverse effect occurs. APAR's UAE facility at Hamriyah — a significant part of its export oil business was restricted to local deliveries due to port closure during the Middle East crisis, causing volume to fall 13.7 per cent year-on-year.
Management has indicated a 10 per cent to 11 per cent EBITDA margin framework for cables; it has not provided an equivalent normalised margin range for the oil division. The sharp difference between Q1 FY27's 19.3 per cent oil EBITDA margin and the 6 per cent to 8 per cent range seen in the preceding comparable quarters nevertheless suggests that the latest margin is unlikely to represent a normalised run rate.
Cable Division: The US Data Centre Opening
Cable revenue grew 29.5 per cent year-on-year to Rs 1,838 crore. Domestic revenue grew 59.9 per cent, supported by Indian Railways procurement and defence supplies. Export revenue fell 13.7 per cent, with US cable revenue up only 2.5 per cent year-on-year.
The strategically significant development for cables is not the current quarter's revenue. It is the approval received during Q1 FY27 from Meta, Microsoft and Google for cable supply to their US data centres. APAR is now approved for supply to contractors servicing these three companies' US data centre buildouts. The US cable market is 66 per cent copper and 33 per cent aluminium. APAR's historical US cable exports have been almost entirely aluminium. These approvals allow APAR to participate in RFQs for copper cables across low- and medium-voltage applications, including PVC, XLPE and rubber-insulated products.
Management stated explicitly: "We've been supplying data centres in India, but we discovered these are totally two different sets of products and you had to build your credentials from scratch in the US. Today we have approvals from all three." The cable order book stands at Rs 1,925 crore versus Rs 1,653 crore a year earlier.
The Annual Trajectory
|
Year |
Revenue (Rs crore) |
Operating Profit (Rs crore) |
OPM |
PAT (Rs crore) |
|
FY23 |
14,336 |
1,267 |
9% |
638 |
|
FY24 |
16,153 |
1,568 |
10% |
825 |
|
FY25 |
18,581 |
1,601 |
9% |
821 |
|
FY26 |
22,902 |
1,922 |
8% |
977 |
|
Q1 FY27 |
6,591 |
758 |
11% |
467 |
The three-year revenue CAGR of 16.9 per cent and profit CAGR of 16.3 per cent indicate strong and relatively consistent underlying growth, although the consolidated trajectory has been less dramatic than the recent Q1 FY27 numbers suggest.
Q1 FY27's PAT of Rs 467 crore in a single quarter compares with FY26's full-year PAT of Rs 977 crore, highlighting the exceptional contribution from the oil division. If oil margins normalise over the remaining three quarters of FY27, reported earnings will naturally moderate from the Q1 annualised run rate. The conductor and cable divisions, however, continue to show stronger structural drivers through premiumisation, order-book growth and new-market opportunities. The key question for investors is therefore how much of Q1's earnings strength can persist once the exceptional oil contribution normalises.
Valuation: The Right Framework
ROCE of 31.8 per cent and 3-year average ROCE of 36.2 per cent reflect strong capital efficiency for a capital-intensive industrial manufacturer. Debt to equity is 0.18x — modest leverage given the scale. Operating cash flow of Rs 968 crore confirms that profits are converting to cash. Free cash flow of Rs 235 crore is positive.
At Rs 17,701, the stock trades at a P/E of 61.5x against a 3-year median P/E of 38.7x. The reported P/E needs to be interpreted carefully because earnings in Q1 FY27 benefited from an unusually strong oil division margin that may not be sustainable. At the same time, EV/EBITDA of 33x also indicates that the market is assigning a substantial premium to APAR's expected earnings growth and business-quality improvement.
EV/EBITDA provides a useful cross-check because it is less sensitive than P/E to changes in the capital structure and reported net profit, although it too reflects the market's expectations for future earnings. The industry P/E of around 26.3x also highlights the substantial premium at which APAR trades, reflecting investor expectations around its premium conductor mix, US cable opportunity and long-term transmission and grid-investment themes.
Why the Five-Year Return Is 2,678 per cent
APAR in FY21 was a Rs 6,388 crore revenue business with Rs 160 crore PAT, generating 7 per cent operating margins. By FY26 it was a Rs 22,902 crore revenue business with Rs 977 crore PAT. Revenue grew 3.6x. PAT grew 6.1x. The premium conductor strategy — including the shift towards HTLS, OPGW, copper conductors and other higher-value products — has been an important contributor to the improvement in product mix and profitability. APAR has benefited from structural tailwinds in transmission, grid investment and higher-value power infrastructure, while its premium-product strategy has strengthened its positioning within these markets.
The Risks
The oil division's Q1 FY27 EBITDA margin of 19.3 per cent is unlikely to represent a normalised run rate for this business given the sharp difference from the preceding quarters. The Middle East conflict that created the oil price spike is an external variable outside management's control. When gas oil prices normalise or fall, the inventory-cost advantage reverses.
Conductor volume decline of 6.7 per cent in Q1 FY27 due to aluminium price-driven delivery deferrals is expected by management to be temporary, but sustained high aluminium prices could delay order execution beyond the expected period.
US conductor exports also face a significant tariff-related challenge under the Section 232 framework. Management indicated that the tariff environment is now part of the operating landscape, although its impact on price competitiveness and order economics will need to be monitored.
The cable division's US approvals from Meta, Microsoft and Google are significant but currently early-stage. Order receipts from contractors servicing these data centres have started but no volume guidance was provided.
The Closing AssesSMEnt
At Rs 17,701, the market is already assigning a substantial premium to APAR's structural growth opportunity. The Rs 10,190 crore conductor order book and rising premium mix provide support for the long-term thesis, while the US cable approvals create an additional growth option. But the investment case now requires evidence that conductor profitability can remain elevated, the cable business can convert its US approvals into meaningful volumes and the oil division can normalise without materially disrupting consolidated earnings.
Disclaimer: This article is for informational purposes only and not investment advice.