Company Quarterly Results
Q1 FY27 Results
2,535 Companies Reported
Compare:
Company
Revenue (₹Cr.)
Q1 FY27Profit/Loss (₹Cr.)
Q1 FY27Revenue of
Q1 FY26Profit/Loss of
Q1 FY26Revenue (%)
YoYProfit/Loss (%)
YoYLatest Result Summary
1342
Profit Growth
1006
Profit Decline
1450
Ebitda Growth
898
Ebitda Decline
1751
Revenue Growth
574
Revenue Decline
957
Operating Profit Margin Growth
1368
Operating Profit Margin Decline
970
Pat Margin Growth
1355
Pat Margin Decline
Heatmap: Latest Quarter Results
Box size reflects market capitalisation, while colour shows latest quarter financial performance on a combined QoQ and YoY basis.
Very Strong
Strong
Neutral
Weak
Very Weak
Last updated up to: 6 October 2026
Quarterly Results of Companies
Vipul Organics reported a 99.75 per cent year-on-year rise in Q1 FY27 consolidated PAT to Rs 2.52 cr...
Lincoln Pharmaceuticals reported Q1 FY27 total income of Rs 201.55 crore, up 19.02 per cent YoY, whi...

INDO-MIM reported consolidated revenue from operations of Rs 1,218.74 crore in Q1 FY27, while profit...
Vadilal Industries reported consolidated revenue from operations of Rs 680.06 crore in Q1 FY27, up 3...
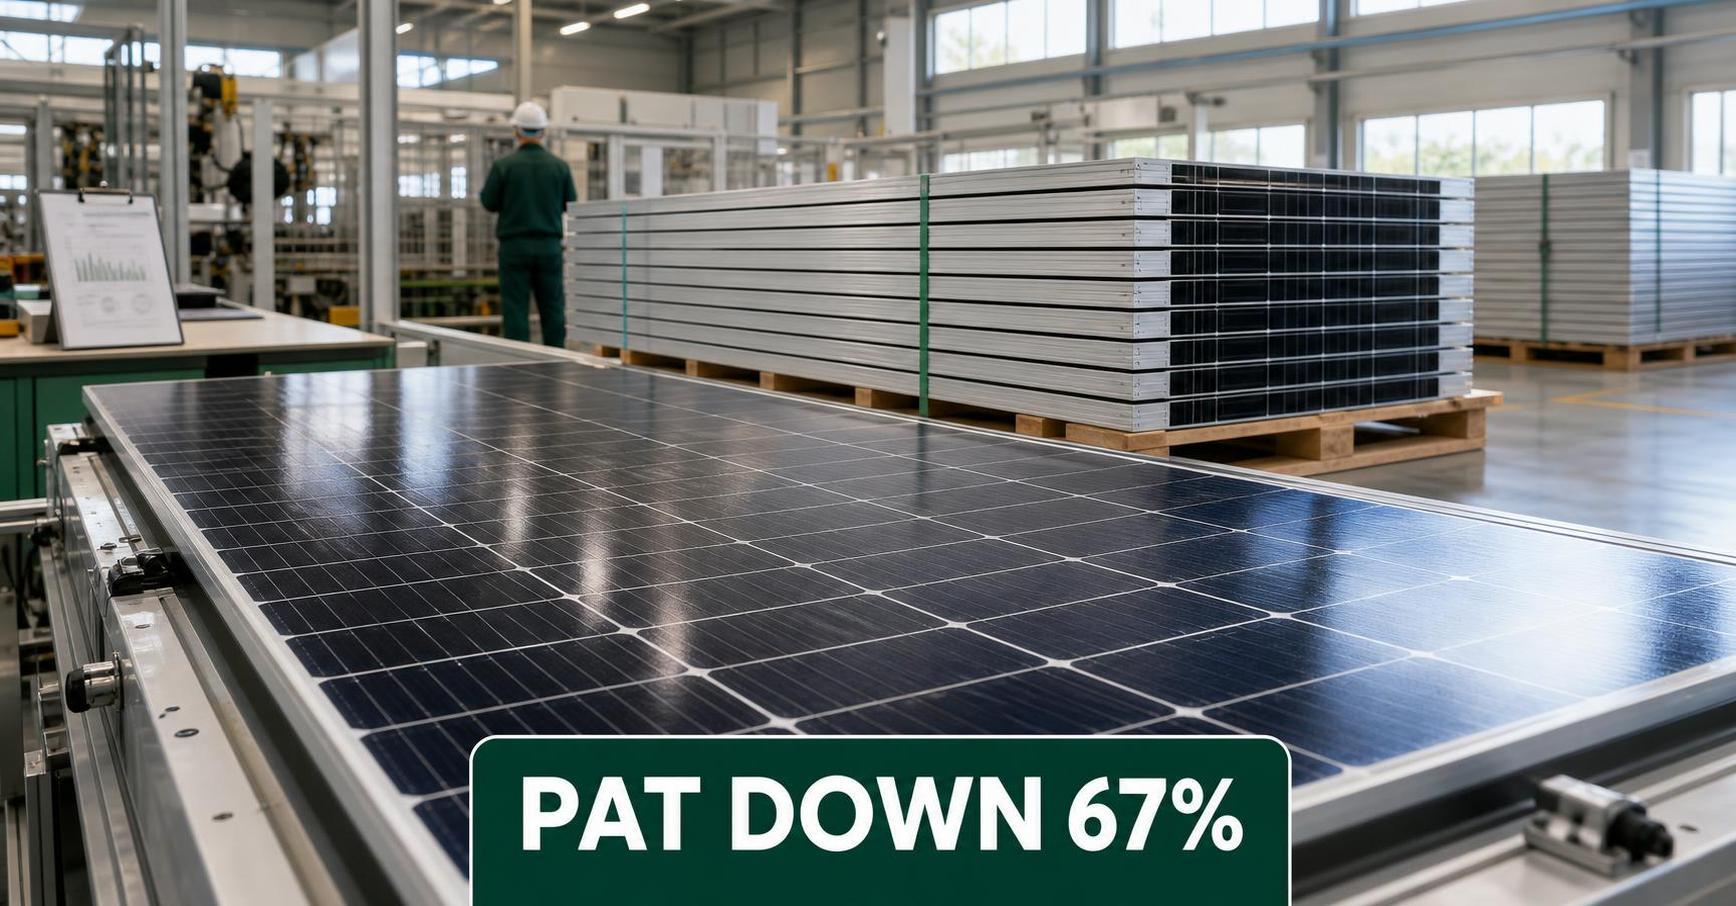
Solex Energy reported consolidated revenue of Rs 265.63 crore in Q1 FY27, while PAT declined to Rs 8...