The Biggest Dividends Rarely Arrive Without Warning. Here Is How to Read the Signals
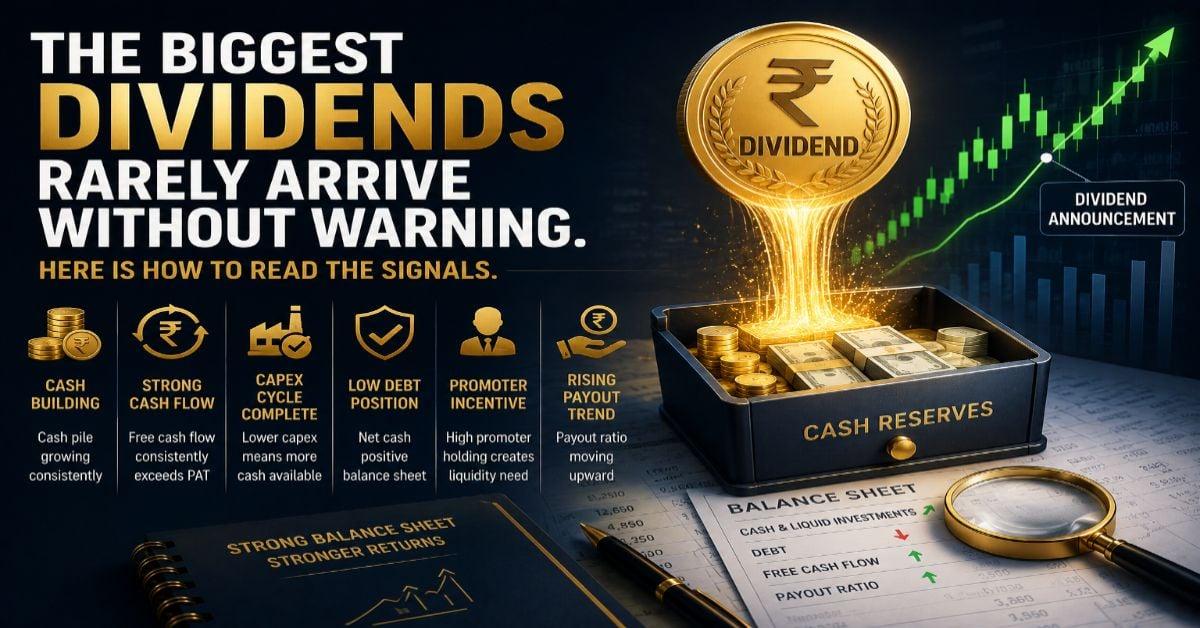
Most investors treat large dividend announcements as surprises. The balance sheet usually knew months earlier
✨ AI இயங்கும் சுருக்கம்
Every earnings season, certain stocks rally sharply after announcing a special Dividend or an unusually large payout. Investors watching from the outside treat these as unexpected windfalls the company surprised everyone. But in most cases, the conditions that made that dividend possible had been building quietly in the financials for several quarters. The announcement was the confirmation. The signal was already there.
Dividend investing is not about finding the highest yield on a stock screener. High yield is backward looking it tells you what a company paid, not what it is likely to pay next. The more useful question is forward looking: which companies are accumulating the financial conditions that typically precede a large payout? That question has an answer, and it is visible in public data before the market prices it in.
The Foundation: Dividends Are Paid From Cash, Not Profit
The most common mistake in dividend analysis is focusing on PAT (profit after Tax) as the measure of a company's ability to pay. A company can report high profits and pay nothing if that profit is tied up in receivables, inventory or reinvestment. Dividends require actual cash sitting in the Bank.
The metric that matters is Free Cash Flow, operating cash flow minus capital expenditure. A company generating Rs 1,000 crore in PAT but spending Rs 800 crore on capex has Rs 200 crore available for distribution at most. A company generating Rs 600 crore in PAT but spending Rs 50 crore on capex has Rs 550 crore available. The second company is the better dividend candidate despite reporting lower profits.
Look for companies where free cash flow has grown consistently over three or more years and where FCF consistently exceeds or tracks closely with reported PAT. That gap between accounting profit and real cash generation is where dividend capacity actually lives.
Signal One: The Cash Pile Is Building
When a company's cash and liquid investments on the balance sheet grow meaningfully year after year without a visible deployment plan, something is coming. Either an acquisition or a return to shareholders. If the company has a thin acquisition history and no announced deal pipeline, the probability of a large dividend or buyback rises significantly.
The pattern is consistent across Indian markets. A company accumulates cash quietly over two or three years, the balance sheet shows net cash positive, management gives no clear indication of what the money will be used for, and then a large special dividend announcement follows. Hindustan Zinc before its special dividends is the textbook Indian example the cash was visible on the balance sheet well before the payout was announced.
The signal to track is not just the absolute cash number but the trend. Cash growing 20-30 per cent year-on-year on a balance sheet with low debt and moderate capex is a strong forward indicator.
Signal Two: Debt Position
A company with significant debt will use excess cash to repay before distributing. This is rational the cost of carrying debt exceeds the benefit of holding cash, and management teams know this. Companies with high debt levels rarely announce large dividends because every rupee of surplus has a competing claim from creditors first.
The clearest dividend signal from the balance sheet is a company that is net cash positive meaning cash and liquid investments exceed total debt. Net cash positive companies with growing FCF have no natural competing use for their surplus. The cash either sits idle, gets deployed in acquisitions or goes to shareholders. Knowing which outcome is more likely requires examining the next factor.
Signal Three: The Capex Cycle Is Complete
Companies actively building new capacity retain cash for that purpose. A steel company commissioning a new plant, a telecom operator rolling out fibre or a manufacturer expanding production lines will not distribute surplus they need it. But when a company has completed its investment cycle and the next major capex commitment is three or more years away, the cash retained for investment no longer has a destination.
Track capex as a percentage of operating cash flow over time. When that ratio has been declining consistently from 60 per cent to 40 per cent to 20 per cent it signals that the reinvestment phase is winding down. The cash being freed up has to go somewhere. Asset-light businesses — IT companies, asset management companies, exchanges, established consumer brands structurally have low capex requirements and are therefore structurally better dividend candidates than capital-intensive businesses in infrastructure, metals or telecom.
Signal Four: The Promoter Incentive
This is the most underappreciated factor in Indian dividend analysis and it deserves direct treatment.
When a promoter holds 50 per cent or more of a listed company and needs personal liquidity for family settlements, to service holding company debt, to fund new investments or for any other reason dividends are one of the most tax-efficient extraction mechanisms available. The promoter receives their proportional share of every rupee distributed. A large promoter holding therefore creates a personal financial incentive that aligns with the minority shareholder interest, at least on the question of cash distribution.
Look at the promoter holding percentage. Then look at whether the promoter's holding company has its own debt obligations. Vedanta is the current example that makes this mechanism transparent — Vedanta Resources, the London-based promoter holdco, has its own debt servicing needs that have historically influenced dividend decisions at the Indian listed entity level. When you understand the promoter's financial position, the company's dividend behaviour becomes more predictable.
The important caveat: sometimes large dividends are driven by promoter cash extraction rather than genuine shareholder friendliness. The distinction matters for how you interpret the payout. A dividend that serves the promoter's liquidity need can still be a good outcome for minority shareholders but it tells you the motivation behind the decision, which affects how sustainable the payout trend is.
Signal Five: The Payout Ratio Trend
A company's dividend payout ratio — dividends paid as a percentage of PAT tells you how management thinks about shareholder returns over time. A payout ratio that has moved from 20 per cent to 35 per cent to 50 per cent across five years is communicating a clear shift in philosophy. Management is progressively prioritising cash returns over reinvestment.
Once a company has established a rising payout ratio trend, the next step in that trend is the most likely outcome rather than a reversal. Companies rarely cut dividends without a specific financial reason doing so signals distress and damages management credibility. A company with a multi-year record of rising payouts has effectively set a floor for investor expectations.
Signal Six: The One-Time Windfall
Special dividends payouts significantly above the regular dividend are almost always balance-sheet events rather than operational ones. A company sells a subsidiary, monetises land, receives a large tax refund or benefits from a commodity price windfall. The cash arrives suddenly and exceeds normal reinvestment needs. Shareholders get a special payout.
These are predictable if you watch for the underlying event. When a company announces an asset sale or receives regulatory approval for a divestment, the special dividend question is not whether it will happen but when. The asset sale creates the surplus; the dividend is the distribution mechanism.
What Not to Do
Do not chase high dividend yield blindly on a stock screener. A sudden spike in dividend yield often happens because the stock price has fallen sharply which may signal deteriorating fundamentals rather than opportunity. The key question is whether the dividend is supported by sustainable cash flow or simply inflated by a falling stock price. Cyclical businesses and stressed PSUs frequently show high dividend yields precisely because the market has reduced confidence in future earnings. Dividend yield rises mechanically when stock prices fall. A high yield on a falling stock is not automatically a bargain it is often the market asking whether the payout is sustainable.
Equally, investors should not confuse a one-time large dividend with durable dividend-paying ability. Special dividends funded through asset sales, windfall profits or surplus cash may boost payouts temporarily, but they do not necessarily reflect the company’s ongoing free cash flow generation. Sustainable dividends come from recurring earnings and recurring cash flow not financial events that happen once.
The Checklist
Before positioning around a potential large dividend, run through these signals.
Is cash on the balance sheet growing year-on-year without a clear deployment plan? Is the company net cash positive or moving toward it? Is FCF growing consistently and exceeding or tracking PAT? Is capex as a percentage of operating cash flow declining? Does the promoter holding create a personal liquidity incentive? Is the payout ratio trending upward over three or more years? Has a one-time windfall event recently occurred or been announced?
The more of these that are simultaneously true, the higher the probability that a large distribution is approaching. No single signal is definitive management can always choose to sit on cash, pursue acquisitions or opt for buybacks instead of dividends. The framework identifies candidates, not certainties.
The market prices what it knows. A large dividend is usually visible in the balance sheet long before it appears in the headline. The investors who find it first are simply the ones who knew where to look.
Disclaimer: This article is for informational purposes only and not investment advice.